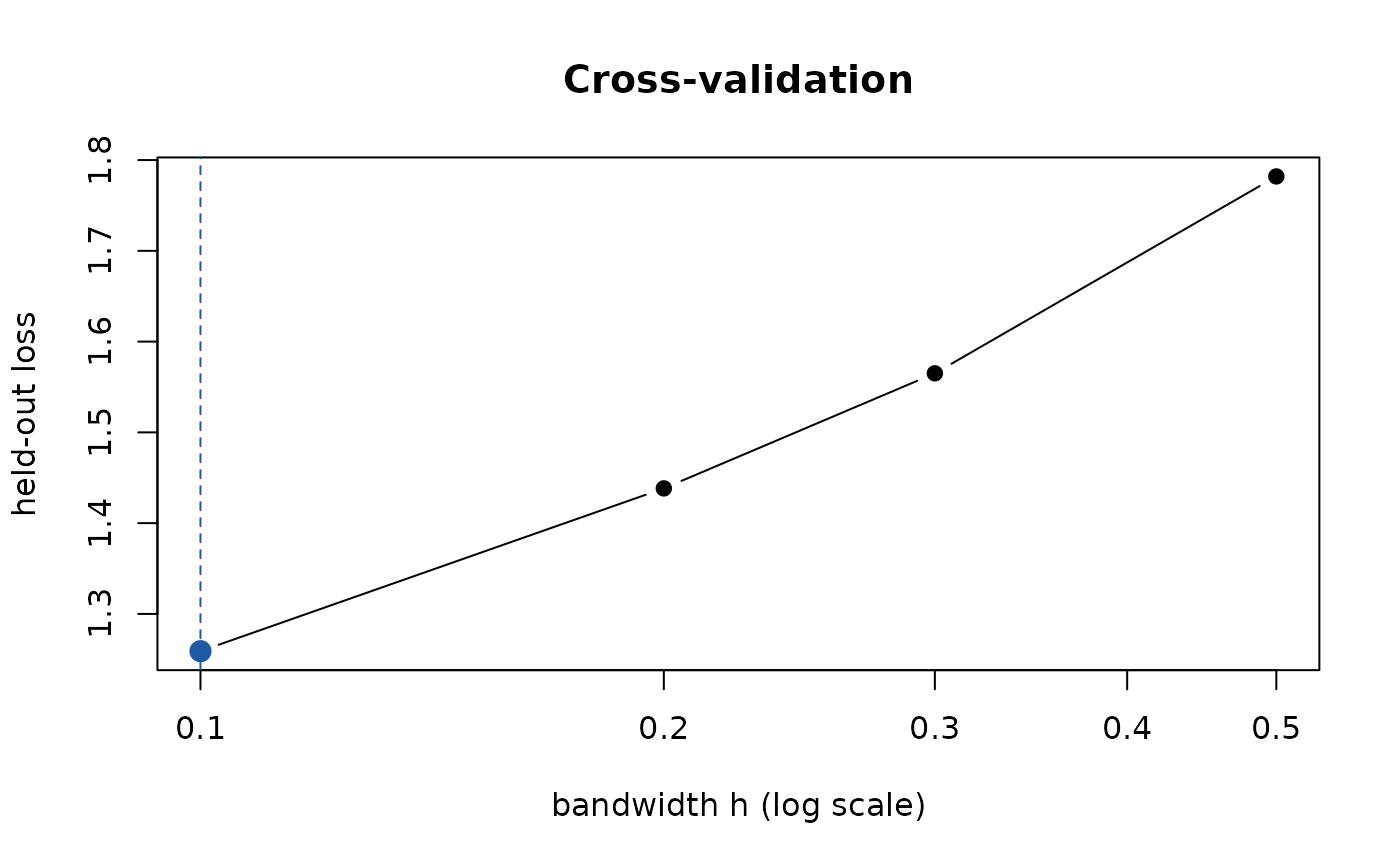
The held-out loss against the candidate bandwidths, with the selected value marked. Worth a glance every time: if the curve is still falling at an endpoint of the grid, the "selected" bandwidth is where you stopped looking rather than a minimum, and the grid should be widened.
Arguments
- x
A
cv.skmleorcv.kee_asyncobject.- ...
Passed to
graphics::plot().
Examples
set.seed(1)
d <- sim_async_data(n = 150)
cv <- d$y |>
  kee_async_cv(d$x, y ~ x,
    id = id, time = time,
    h_grid = c(0.1, 0.2, 0.3, 0.5), K = 3, seed = 1, quiet = TRUE
  )
#> Warning: the selected bandwidth is at an endpoint of 'h_grid'; widen the grid to check that the minimum is interior
plot(cv)