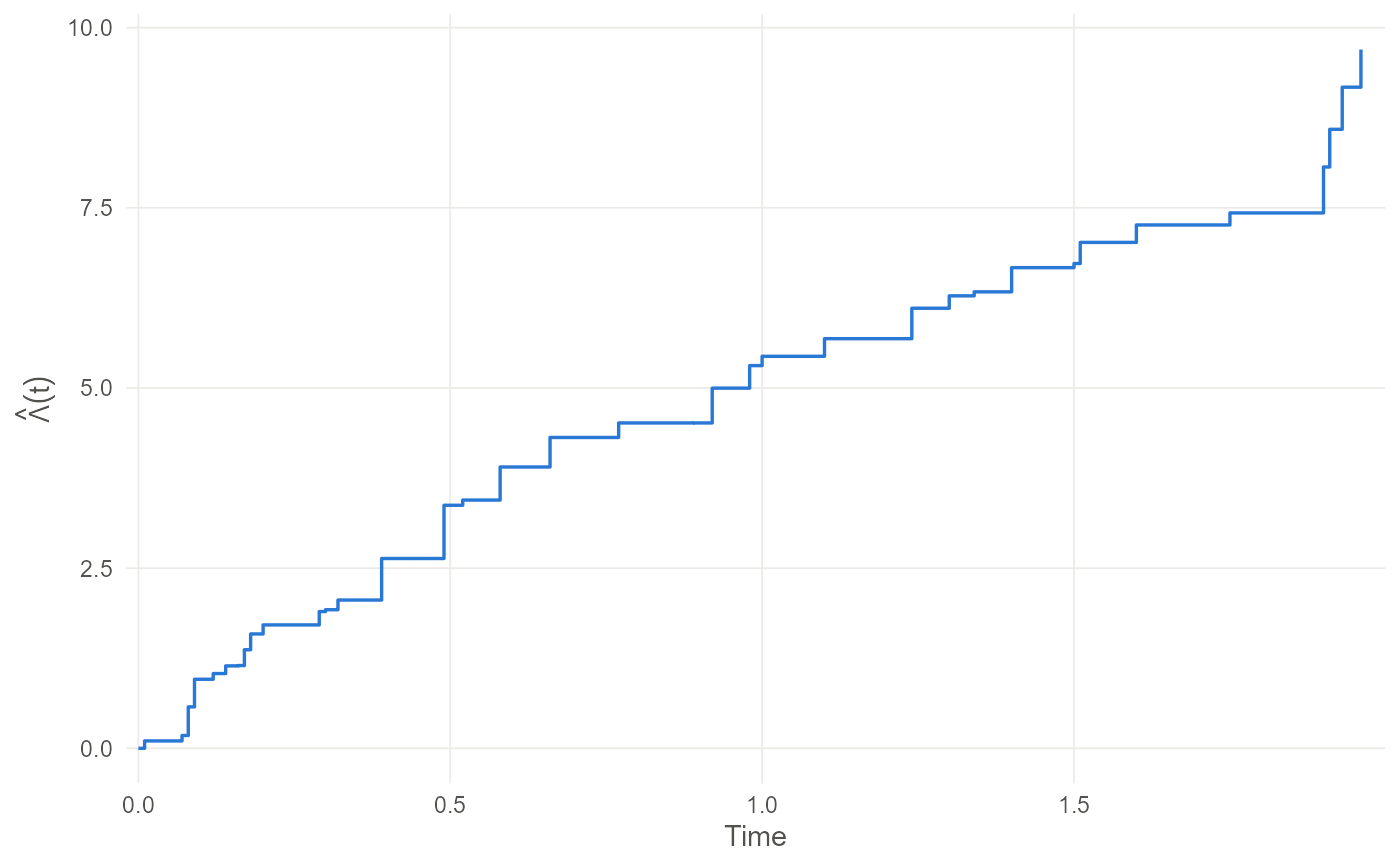
Plot the estimated baseline function
Usage
# S3 method for class 'pcdfit'
autoplot(object, ...)

# S3 method for class 'pcdfit'
plot(x, ...)
Arguments
- object, x
A fitted pcdreg() model.
- ...
Ignored.
Value
A ggplot2::ggplot() object: a step function of the cumulative
baseline rate for the rate model, or of the baseline mean for the means
model. autoplot() returns it; plot() draws it and returns it
invisibly, so it can be used for its side effect like any other plot()
method.
Details
The rate model's \(\hat\Lambda\) increases by construction. The means
model's \(\hat\mu\) need not, and with covariates that fluctuate it
generally does not; it is drawn as estimated rather than forced upwards,
because that behaviour is the point of the comparison between the two models.